Prev: Project Objectives Next: Clinical Decision Support
Project Results: Novel MRI data analysis algorithms and tools
Algorithm development was a predominant part of the CDSQuaMRI project and yielded a number of advanced methods and tools for the analysis of various MR imaging modalities. These methods were implemented as individual stand-alone software packages which in a second step were integrated in processing workflows in the framework platform.
Anatomical MRI: myelin & relaxation
Methods have been developed that enable the extraction of quantitative information about tissue micro-structure from qualitative anatomical brain MRI scans. These methods were initially based on regression techniques. More recently, methods based on artificial intelligence have been developed. Results demonstrated that whenever specialized quantitative protocols are not available, approximate myelin and relaxation indices can be obtained from qualitative scans (F These findings demonstrate that the CDS-QuaMRI clinical decision system could be used for the retrospective analysis of large existing data bases of clinical scans, providing important insight on long-term changes to brain micro-structure in neurological disorders.
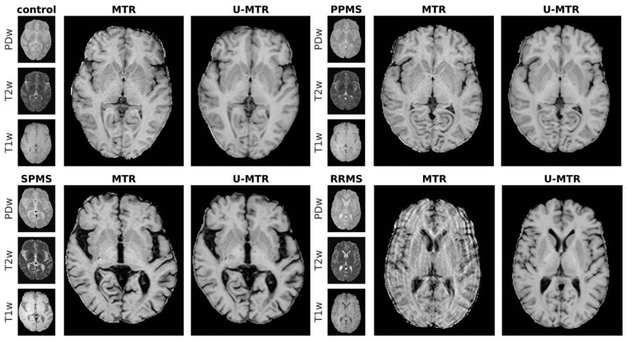
Figure 1: Examples of synthetic Magnetization Transfer Ratio (MTR, i.e. a myelin-sensitive metric) produced via U-Nets (U-MTR) from qualitative MRI scans that are routinely performed in radiology departments. The images in the top-left, top-right and bottom-left corner show qualitative images, ground-truth MTR and U-MTR results for one control, primary progressive multiple sclerosis (PPMS) and secondary progressive multiple sclerosis (SPMS) test-subjects. U-MTR appears very similar to the ground-truth, with the exception of the noise characterizing MTR maps. In the bottom-right corner, one relapsing remitting multiple sclerosis (RRMS) subject is shown. I was excluded from the cohort due to the corrupted ground-truth.
Microstructural MRI: diffusion
Several novel methods for microstructural MRI have been developed throughout the course of the project:
1) Microscopic susceptibility anisotropy mapping: a novel technique that tears apart the two principal effects conflated in gradient-echo measurements, (a) the susceptibility properties of tissue micro-environments, especially the myelin microstructure, and (b) the axon orientation distribution relative to the magnetic field.
2) Neural Soma Imaging: To capture the heterogeneous morphology of grey matter, it is imperative to disentangle cylindrical and spherical geometries commonly attributed to neurites and neural soma, respectively, but also to regress out orientation heterogeneity in nervous tissue. This is achieved by leveraging the latest advances in B-tensor diffusion encoding and deep-learning techniques and present microstructural feature maps of neurites and neural soma in-vivo in the human brain
3) Spherical Mean Technique (SMT): this is a clinically feasible method for microscopic diffusion anisotropy imaging. The purpose is to map microscopic features unconfounded by the effects of fiber crossings and orientation dispersion, which are ubiquitous in the brain. SMT comes in two flavors, using a microscopic tensor model and a multi-compartment microscopic model. The former model maps the microscopic diffusion coefficients parallel and perpendicular to the axons and then derives the microscopic fractional anisotropy, which were only available with clinically prohibitive scans thus far. The second SMT model provides estimates of microscopic features specific to the intra- and extra-neurite compartments, such as an index of neurite density.
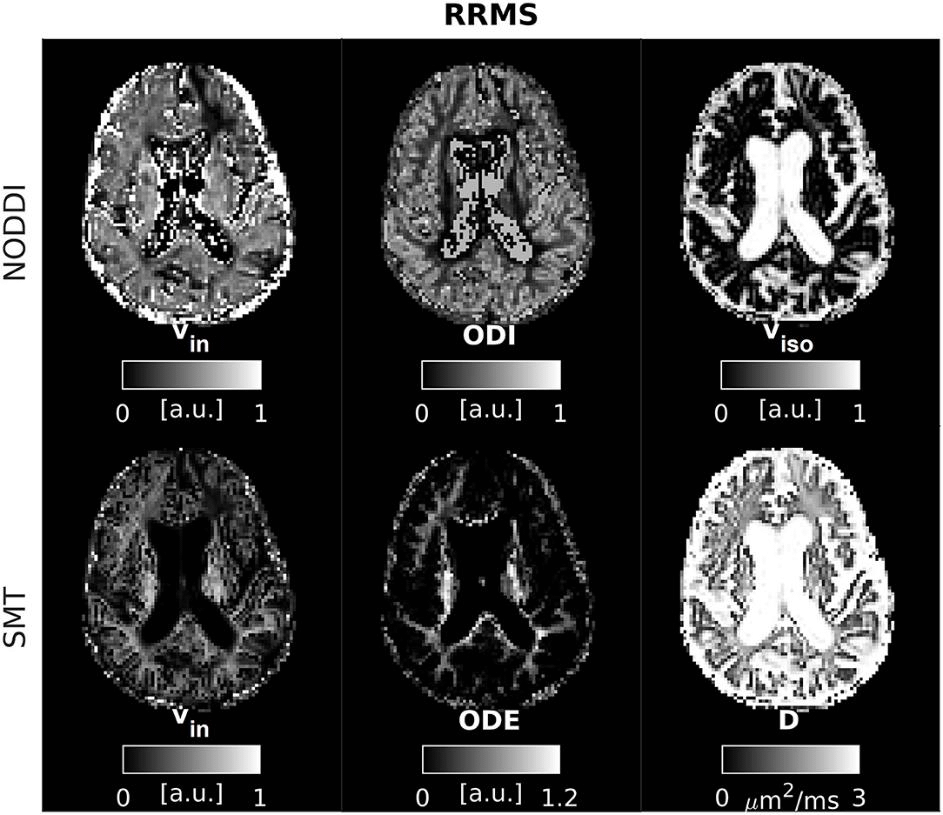
Figure 2: Neurite Density and Orientation Dispersion Index (NODDI) and Spherical Mean Technique (SMT) metrics as obtained from an MS patient. Top: NODDI (left: intra-neurite volume fraction vin; orientation dispersion index ODI; isotropic volume fraction viso); bottom: SMT (intra-neurite volume fraction vin; orientation dispersion entropy ODE; neural diffusivity D).
Functional MRI
Several methods for data analysis and feature extraction from resting-state and task-based fMRI were developed:
1) A new method for comprehensive data visualization called “Brainglance”. The method allows all analysis steps to be carried out in the native subject space, thus supporting “single subject analysis”. The results are summarized on the group level, allowing to assess the heterogeneity within a group without destroying information about individual subjects. In a clinical context, it is vital to preserve such individual information.
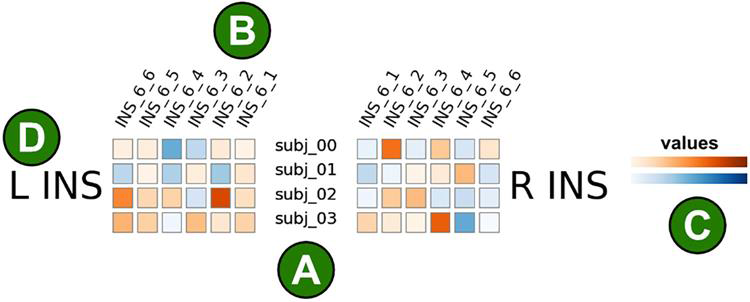
Fig 3: Illustration of the brain glance visualization. Each colored square corresponds to a single brain area from a single subject. (A) Subjects are shown in rows, here we show four subjects. (B) Brain areas are shown in columns. Here, six brain regions within the insular cortex are visualized. (C) The color corresponds to the measured value of interest, this could for instance be the strength of an activation. The color mapping is customizable, here we show positive values in orange and negative values in blue. (D) This figure only visualizes illustrative data from the insular cortex.
2) A new method called “Local Indicators of Spatial Association (LISA)” for statistical inference of fMRI data. LISA is a method to statistically detect local activation in the human brain, using a non-parametric and threshold-free framework. The key component is a non-linear filter for incorporating spatial context without sacrificing spatial precision. Multiple comparison correction is achieved by controlling the false discovery rate in the filtered maps. Compared to widely used other methods, LISA shows a boost in statistical power and allows to find small activation areas that have previously evaded detection, which then can be used as features for further analysis.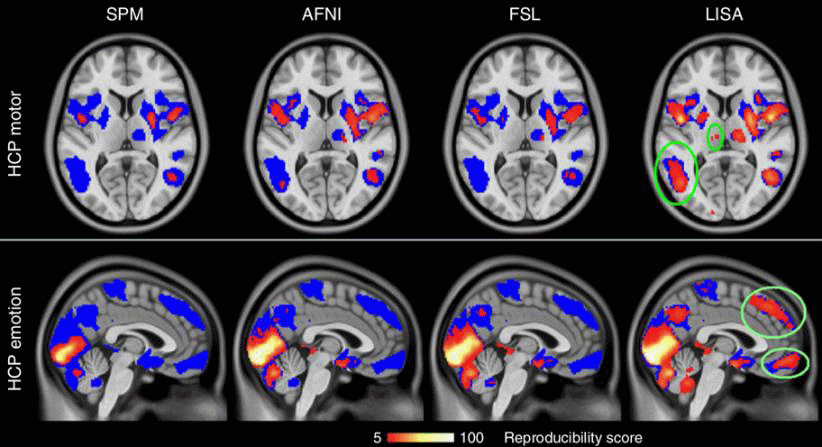
Figure 4: Statistical inference with the newly developed LISA method has a much higher reproducibility as compared to standard methods such as SPM, AFNI and FSL. The reproducibility across 100 tests was based on randomly drawn samples of size 20 from the human connectome project motor data. The colors represent reproducibility scores, i.e., the number of tests in which a given voxel consistently passed the significance threshold.
3) A new method called “Bipartite connectivity mapping (BCM)” for analyzing connectivity in resting state fMRI between two brain regions. The main idea is to represent connectivity between the regions as a bipartite graph and analyse it using bipartite network projections. The advantage of this approach is that it allows to fully preserve spatial precision in both ROIs. This sets it apart from traditional seed-based connectivity mapping where the seed ROI must be averaged so that its spatial information is lost.
4) Two major improvements to a previously published method called "Eigenvector centrality mapping" (ECM). The improved version brings a significant improvement in computational speed and allows to apply ECM to ultrahigh resolution images.
5) A new method for revealing task-induced edge density (TED). TED considers transient networks in response to external stimuli. A major advantage compared to other methods is that it does not depend on any specific hemodynamic response model. It also does not require a pre-segmentation of the data for dimensionality reduction as it can handle large networks consisting of tens of thousands of voxels.
Brain Perfusion: arterial spin labeling
A novel arterial spin labeling /(ASL) acquisition technique was developed. It interleaves the standard ASL acquisition sequence with a measurement of labeling efficiency which occurs during ‘dead space’ naturally present in ASL acquisitions. With this approach, the labeling efficiency can be measured without any time-penalty. The technique was validated and the importance of labelling efficiency was proven in an subject study, in which sub-optimal labeling efficiency resulted in underestimation of cerebral perfusion within a single flow territory.
A correction scheme for motion artefacts in ASL images acquired with the Multiband technique was developed and used to further increase the robustness of the ASL analysis.
Improvements in precision and accuracy of ASL
Several improvements have been implemented to improve the precision and accuracy of ASL. Most of the improvements center around the highly efficient monitoring of the inflow of labelled spins. Such dynamic monitoring can be achieved by time-encoded ASL. Importantly, a sequence has been designed for the simultaneous acquisition of a 4D angiogram (dynamic passage of label through the arterial tree) and a perfusion scan. Such combined macro- and microvascular characterization of the hemodynamic state of a patient, will be very important for individualized treatment selection, e.g. in patients with carotid occlusive disease. Additionally, the arterial arrival times of the labelled spins can be measured with a traditional ASL scan. Information on the arterial arrival time improves the quantification of cerebral blood flow measurements and will also correct for delayed arrival of labelled spins in elderly subjects. These combined measurements have been implemented on the scanner and the necessary post-processing software has been implemented.
ASL – cortical architecture and network analysis
Partial volume correction algorithms are essential for discriminating between perfusion changes and atrophy (loss of brain tissue). This is especially important in the context of the CDS-QUAMRI project focusing on a clinical support system for personalized treatment.
Determination of main flow territories from traditional ASL scans based on the assumption that each flow territory will exhibit unique signal fluctuations was studied. It was demonstrated that natural occurring fluctuations are not large enough to identify the main flow territories, but that by inducing tiny additional fluctuations into the ASL-signal, joint estimation of perfusion images and the main flow territories becomes feasible.
Metabolic MRI: proton and non-proton magnetic resonance spectroscopy
MRSI reconstruction of under-sampled data
Several novel magnetic resonance spectroscopic imaging reconstruction methods have been developed for accelerated undersampled 1H MRSI: (i) overdiscrete static magnetic field inhomogeneity (B0) correction and sensitivity encoding (SENSE) reconstruction; (ii) neural-network based GeneRalized Autocalibrating Partial Parallel Acquisition (GRAPPA) reconstruction and (iii) a hybrid SENSE and compressed sensing reconstruction. The neural network reconstruction is superior to both classical parallel imaging and compressed sensing reconstruction. It can be combined with overdiscrete SENSE for optimal SNR and enhanced spatial resolution.
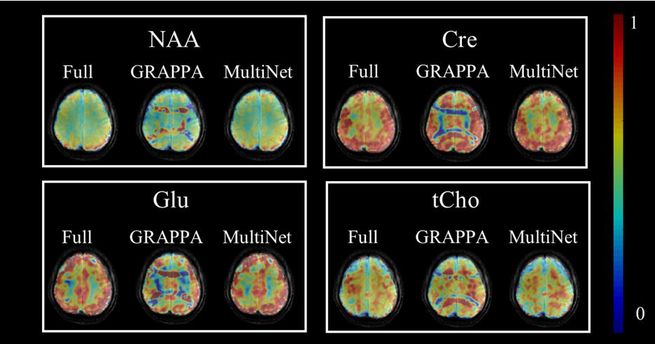
Figure 5: Comparison between metabolite maps for 4 major brain metabolites derived from fully k-space sampled data (left) and four fold k-space under sampled data with conventional GRAPPA (mid) and neuronal network based reconstruction (right). The neural network reconstruction removes the lipid artefacts and yields metabolite maps that correspond to the non-accelerated MRSI data.
MRSI quantification
A quantification pipeline correcting MRSI spectral fitting results for relaxation times of metabolites and tissue water was implemented. To that segmentation of high-resolution anatomical images into tissue fraction maps of grey matter, white matter, and cerebrospinal fluid and recently measured T1-relaxation times of water and metabolites were utilized. The T1-relaxation time for each metabolite is corrected for each voxel from the MRSI acquisition considering its specific voxel composition by utilizing the tissue probability maps and GM and WM T1-relaxation time estimates for 9.4 T. T1-relaxation times for water in GM, WM, and CSF were taken from 9.4 T human results from Hagberg, et al. . Metabolite maps are co-registered to high resolution MP2RAGE images via rigid body transformations. Then, quantification of metabolite maps using an internal water reference is performed by utilizing the method as described by Gasparovic et al.5; hence, concentrations are reported in molal.
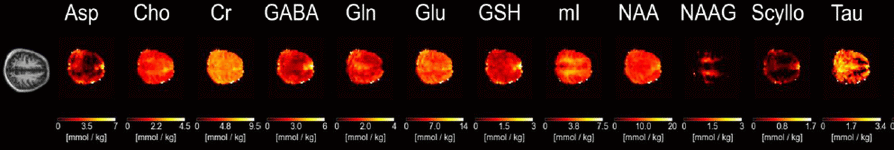
Figure 6: Quantitative metabolite maps for 12 brain metabolites in the human brain derived from 1H MRSI data acquired at 9.4T.
Spectral Fitting Algorithms & Spectral Models
A versatile spectral fitting algorithm – ProFit 1D - for modelling of 1D spectra was developed. It allows for integration of spectral models of all detectable metabolites and macro-molecules and considers imperfections with respect to line width, line shape, chemical shift offsets, phase and baseline. The prior knowledge based model spectra of all relevant metabolites is fitted to the experimental spectra in an iterative matter with increasing degrees of freedom per iteration but tightened boundaries.
A ProFit 2D spectral fitting algorithm was further developed to fit data acquired with an adiabatic J-resolved semiLASER sequence by implementing a dedicated fit model and to support the internal water reference standard.
Metabolite spectra are overlapped by broad resonance lines. This so-called macromolecular signal origins from amino acids of protein and peptide chains. In order to account for the macromolecular signal contribution to metabolite spectra during the spectral fitting procedure a relaxation corrected macromolecular model was developed. This enables automatized simulation of a macromolecular spectrum for any given sequence parameters inside the spectral fitting software ProFit 1D that was developed during the CDS-QUAMRI project (Figure 11 / left). A respective manuscript is currently under review. As input to the development of the relaxation corrected MM model T1 and T2 relaxation times of macromolecular peaks up-field and downfield of water have been measured in the human brain at 9.4 T for the first time (Murali-Manohar et al 2020 & 2021). Estimation of the relaxation times of macro-molecules not only helped develop the above-discussed relaxation corrected MM simulation model and thus improve the estimation of tissue metabolite concentrations, but also helped in quantification of macromolecule concentrations itself.
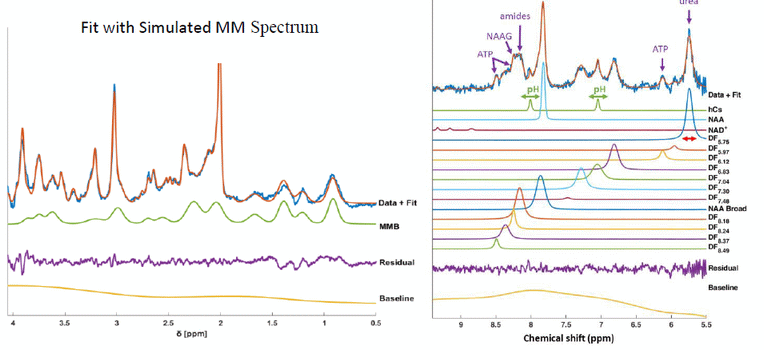
Figure 7: (left) Spectral fit of MC-semiLASER data that includes a relaxation corrected macromolecular baseline model (MMB) in the spectral basis vector. (right) A sample downfield spectrum (Data+Fit) with all quantified metabolites/peaks. The pH dependence of the chemical shift of homocarnosine (hCs) was investigated (green arrows). The red arrow points to the means of measuring the line width of each peak. From the quantified properties, several peaks could be assigned to metabolites, with the most important finding shown by the purple arrows.